Extract structured data from Wikidata using Python and SPARQL query
Wikidata is a free and open knowledge base that can be read and edited by both humans and machines. At this moment it contains more than 94 million entities.
Each entity has unique ID staring with Q followed by number, and number of properties with values.
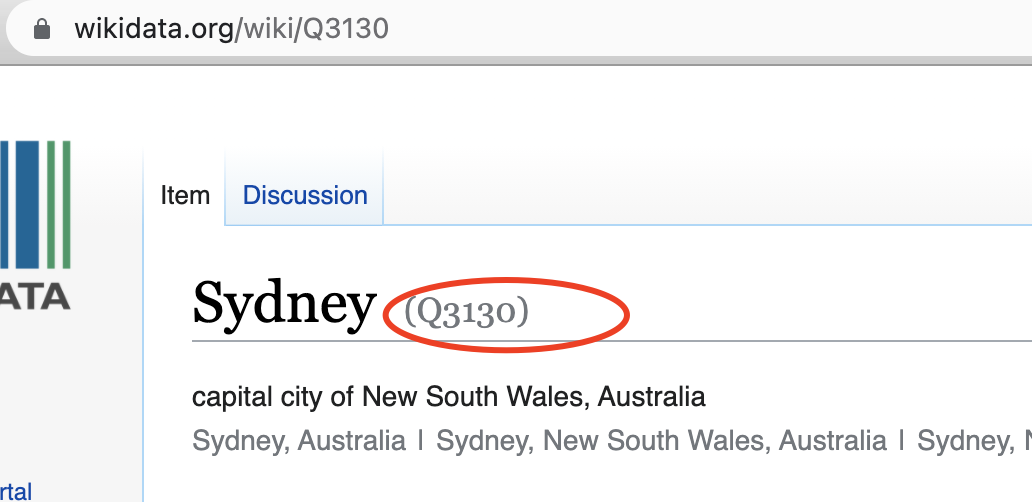
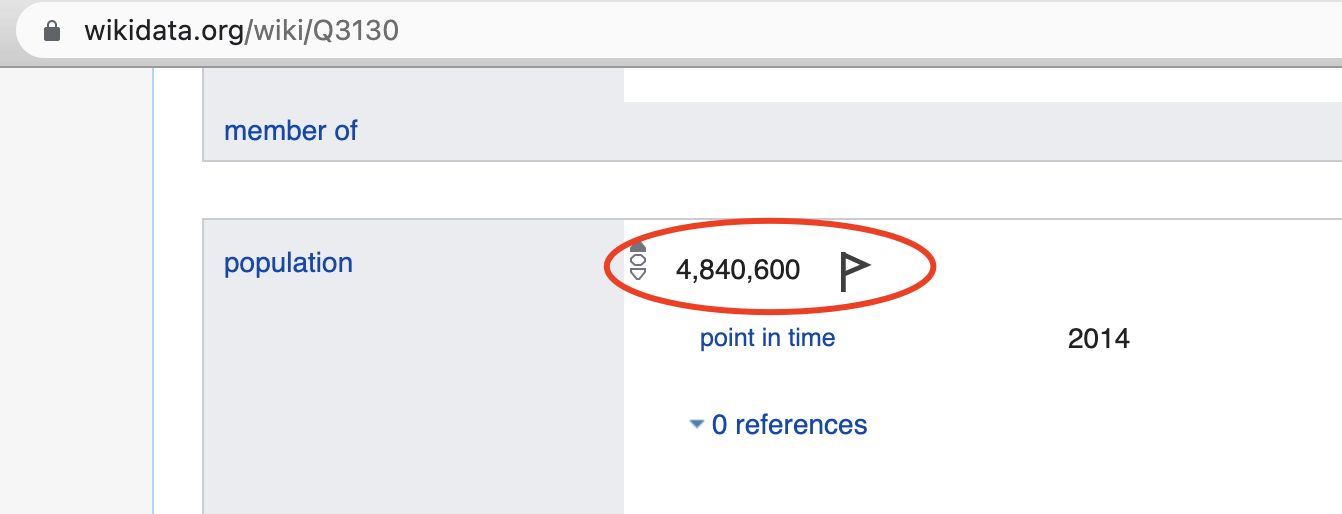
For example for city of Sydney in Australia has ID Q3130. This entity has property “population” with ID P1082 which contains city’s population.
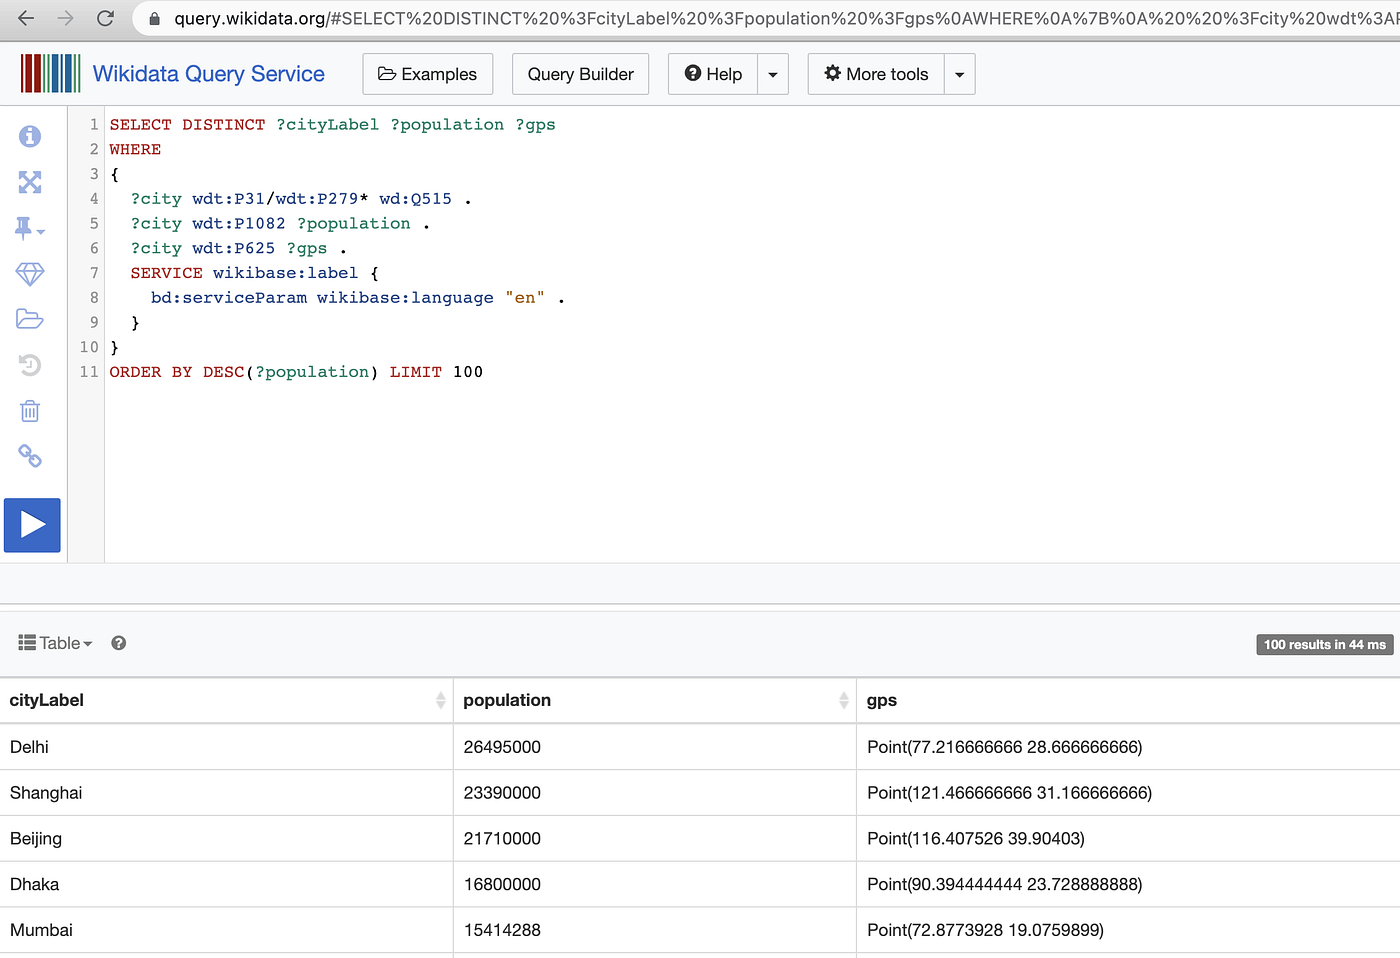
Since this data is stored in structured format, you can load that data by executing SPARQL query. For example following query loads world cities with largest population. We filter entities by ones having “instance type” (P31) or “subclass of” (P279) equal to “city” (Q515).
It returns table with 100 cities with its name in English, population (property P1082) and geographical coordinates (property P625).
SELECT DISTINCT ?cityLabel ?population ?gps
WHERE
{
 ?city wdt:P31/wdt:P279* wd:Q515 .
 ?city wdt:P1082 ?population .
 ?city wdt:P625 ?gps .
 SERVICE wikibase:label {
 bd:serviceParam wikibase:language “en” .
 }
}
ORDER BY DESC(?population) LIMIT 100
This query can be executed using Wikidata Query Service. Run query.
Data can be loaded with python using mkwikidata library https://github.com/maxim75/mkwikidata. Let’s install library using pip
!pip install mkwikidataNow import mkwikidata and run query using run_query() method:
import mkwikidataquery = """
SELECT DISTINCT ?cityLabel ?population ?gps
WHERE
{
  ?city wdt:P31/wdt:P279* wd:Q515 .
  ?city wdt:P1082 ?population .
  ?city wdt:P625 ?gps .
  SERVICE wikibase:label {
    bd:serviceParam wikibase:language "en" .
  }
}
ORDER BY DESC(?population) LIMIT 100
"""
query_result = mkwikidata.run_query(query, params={ })
Wikidata response looks like this:

Let’s convert response into array of dict objects with “name” and “population” keys using python list comprehension:
data = [{"name" : x["cityLabel"]["value"], "population" : int(x["population"]["value"])} for x in query_result["results"]["bindings"]]Convert it into pandas DataFrame and create bar graph with cities:
import pandas as pd
pd.DataFrame(data).set_index("name").head(10).plot.barh().invert_yaxis()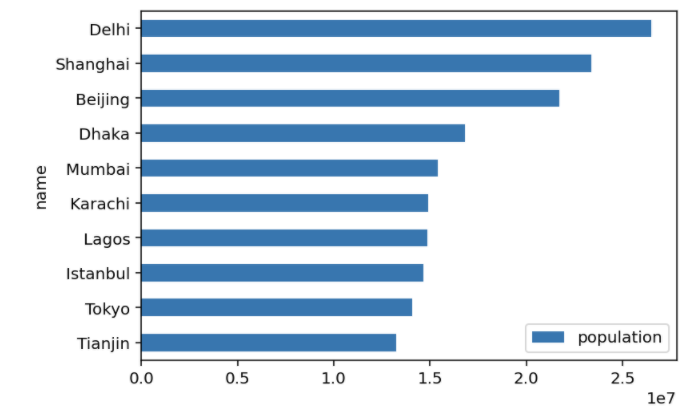
As you can see Delhi is now largest city on planet with population of more than 25 millions.
Complete example can be loaded and run in your browser using Google Colab: